
Connect


Are you prepared to unlock actionable insights with crystal-clear reporting? We are thrilled to unveil the second quarter (Q2 2024) release of our enhanced reporting suite! This update features cutting-edge Microsoft SQL Server Reporting Services (SSRS) reports and interactive Power BI dashboards.
Driven by our passion for empowering you, we are committed to continuous innovation. Our reporting tools streamline data usage across all solutions, making it easier than ever to obtain the insights you need. This latest release revolutionises how you access and use information, delivering top tier reporting solutions that make your data come to life.
Dive deeper into the power of clear, actionable insights with our SSRS reports and Power BI dashboards. Explore the full potential of this release and transform your data experience. Join us as we take you on a journey through the future of reporting, where data becomes your most valuable asset.
For organisations that depend on GSP – Risk, managing risks effectively is crucial. Our reports provide a detailed overview of your risk landscape, enabling you to make decisions based on data.
For the latest SSRS reports and Power BI dashboards tailored to GSP – Risk, click here. This link will guide you to resources that are instrumental in transforming your risk management practices.
Showcase Risk Dashboard on Power BI
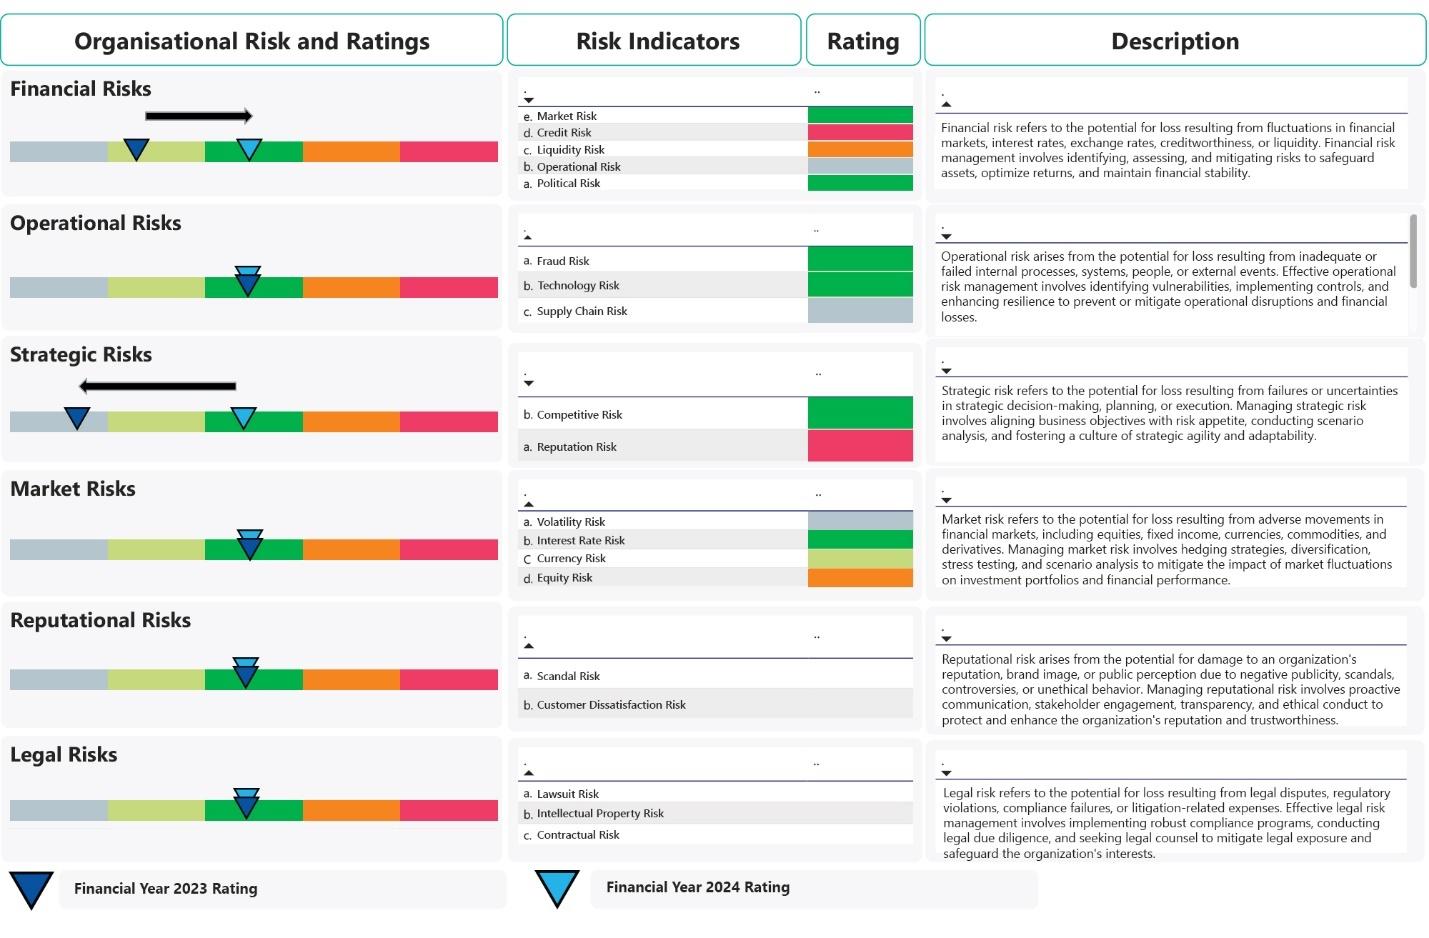 Figure 1.1: Organisational Risk Summary
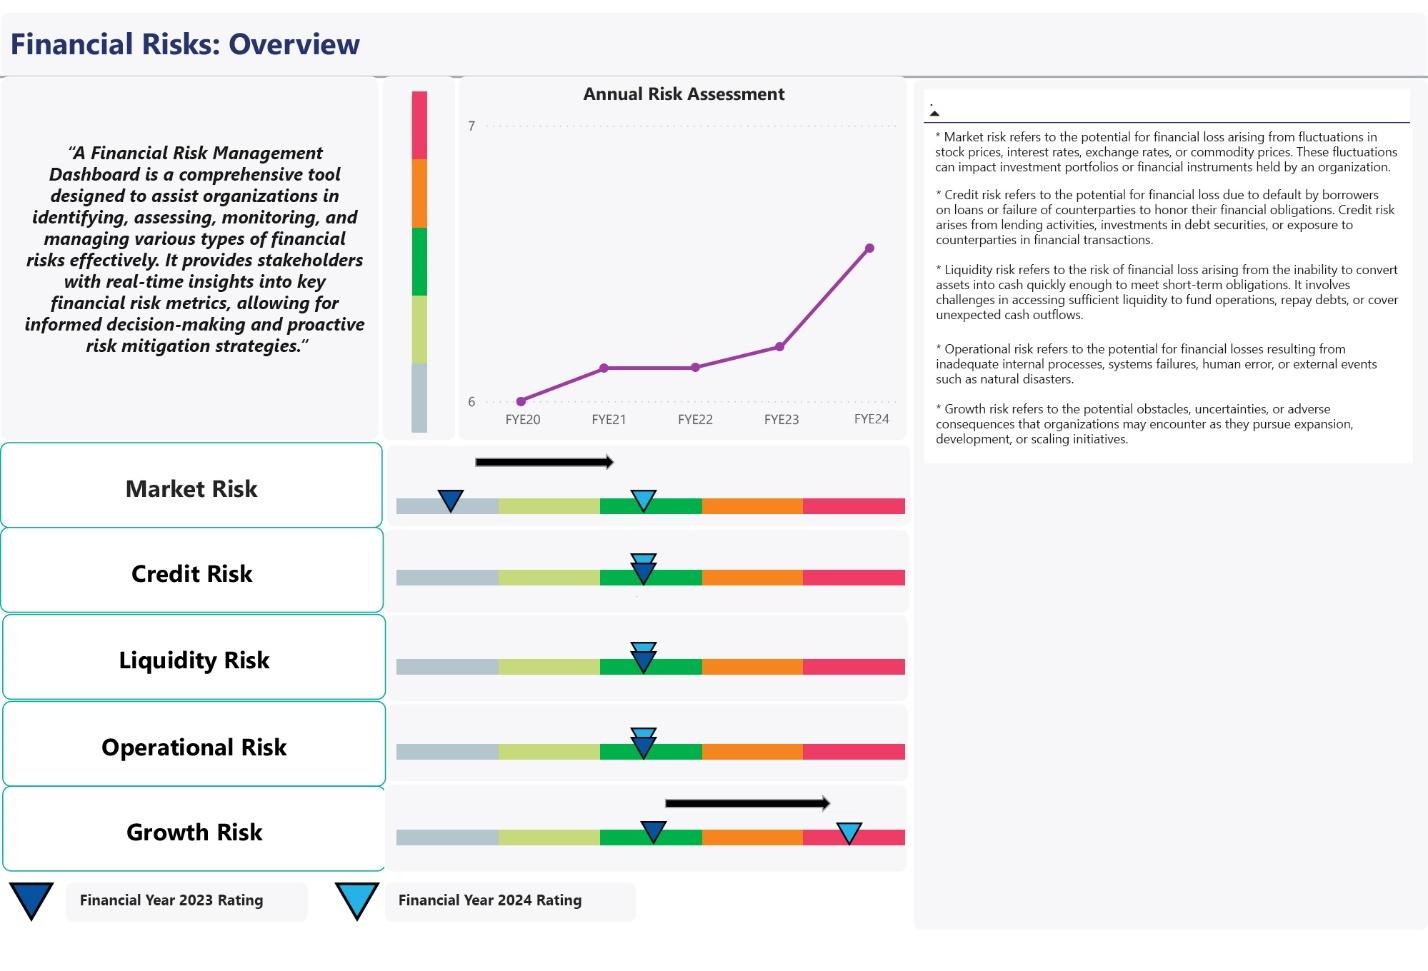 Figure 1.2: Financial Risks: Overview
 Figure 1.3: Market Risk
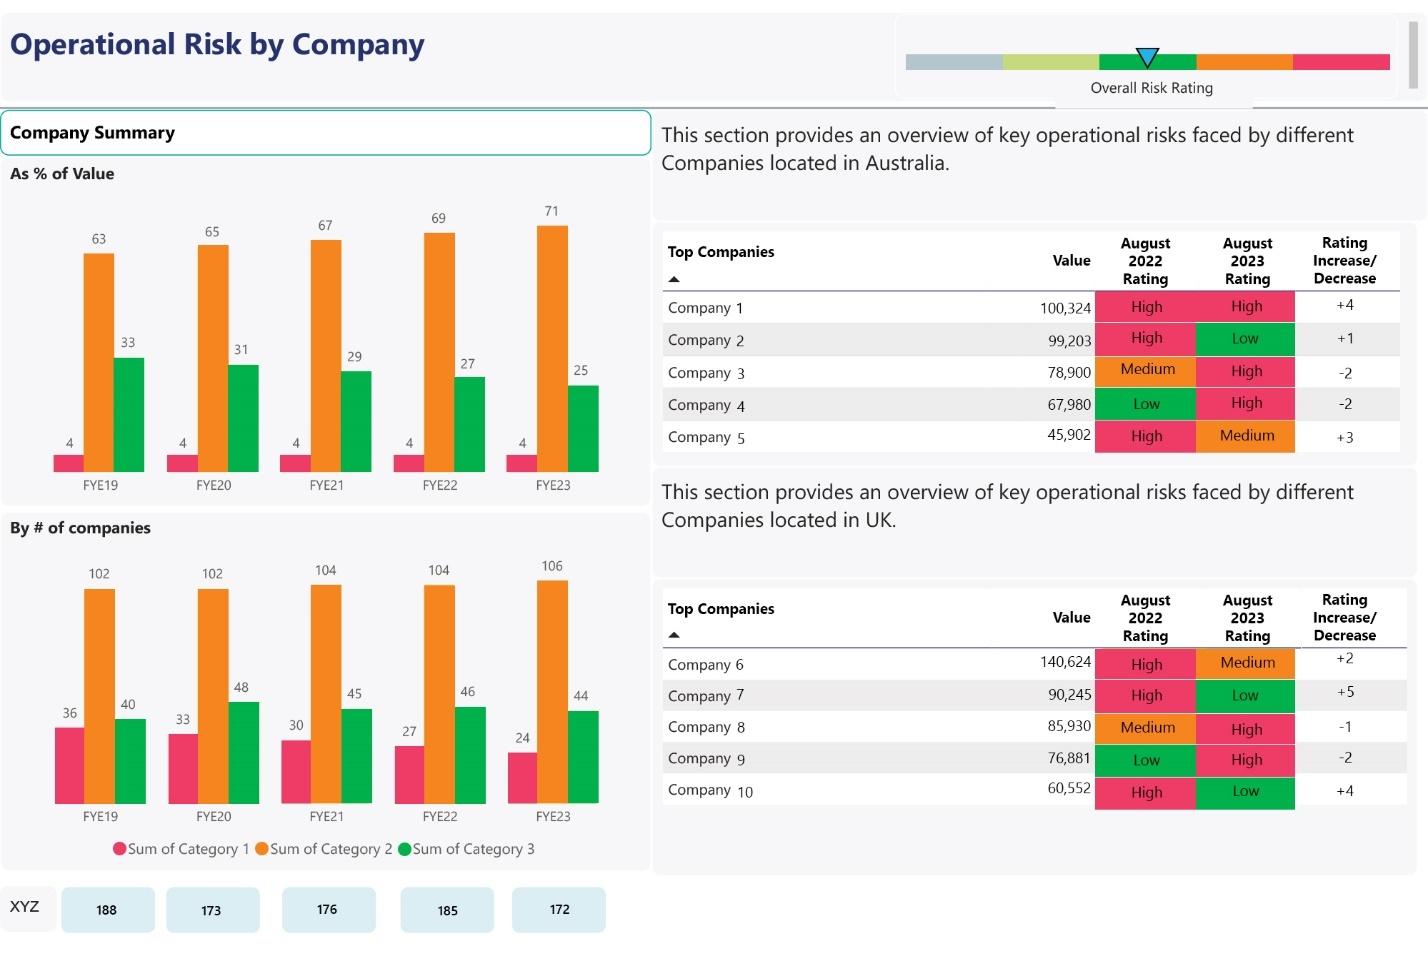 Figure 1.4: Operational Risk by Company
 Figure 1.5: Strategic Risk Monthly Summary
The customisable Microsoft Power BI dashboard, shown above, provides a comprehensive overview of the organisation’s risks, comparing their risk ratings across two financial years. Its interactive features allow detailed exploration of each risk, including annual risk assessments, linked risk breakdowns, company risk rating comparisons, and monthly key risk summaries.
Standard Risk Update Report
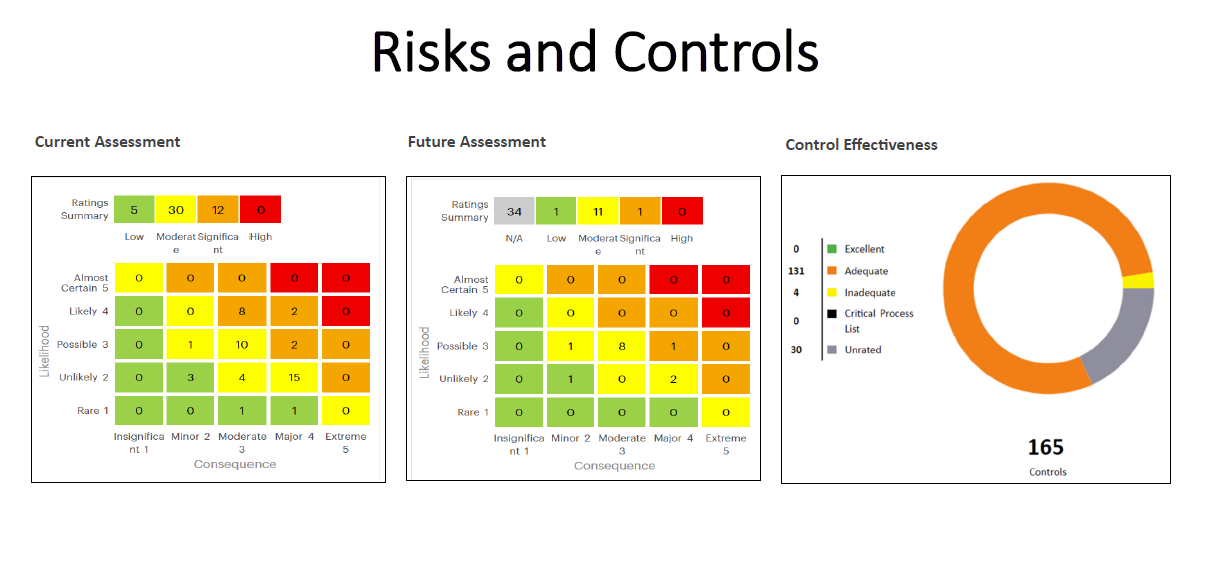 Figure 2.1: Risks and Controls
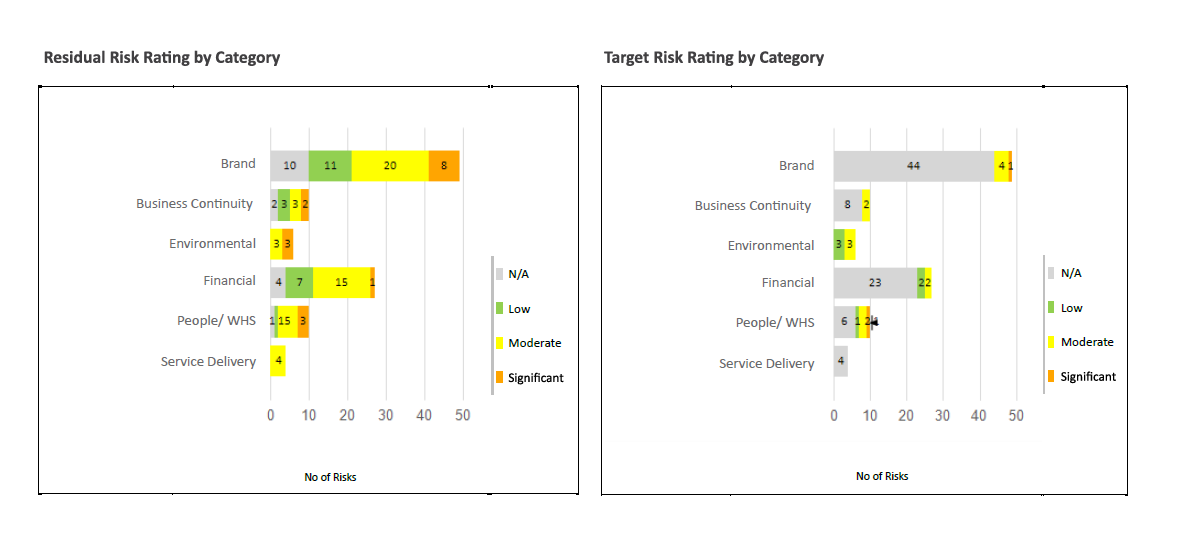 Figure 2.2: Risk Rating
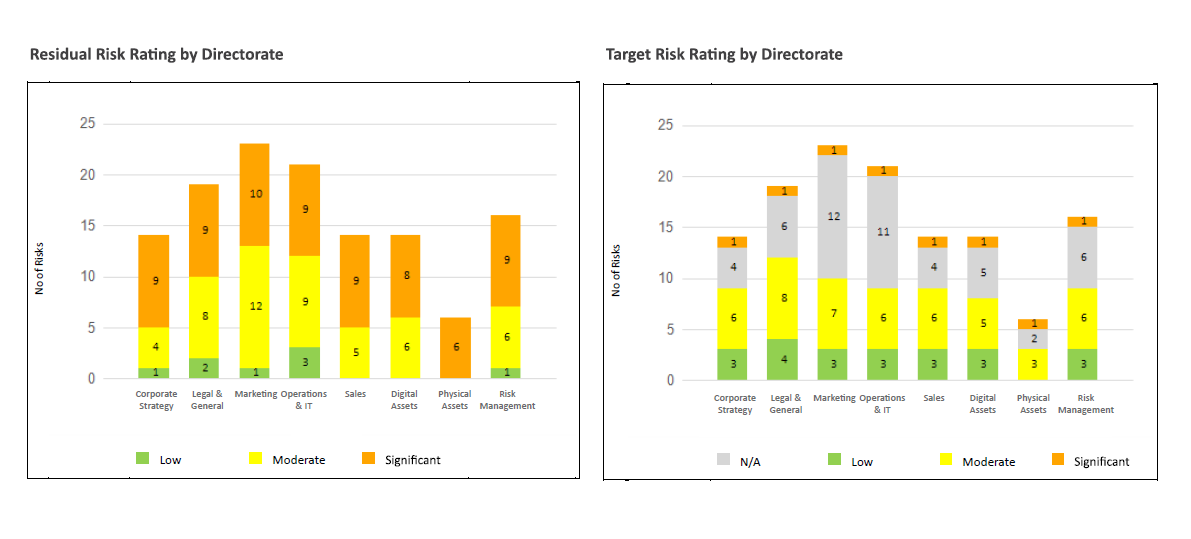 Figure 2.3: Risk Rating
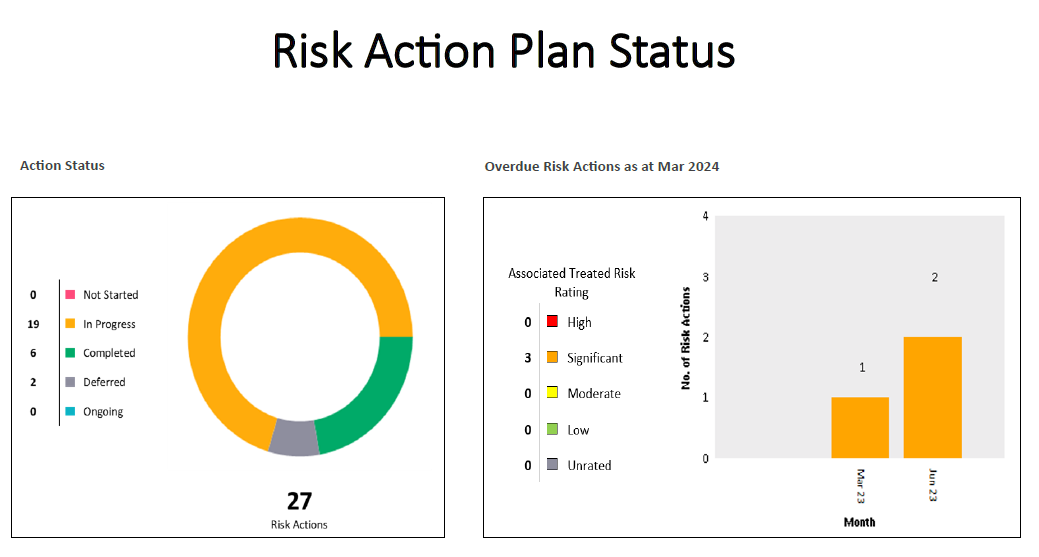 Figure 2.4: Risk Action Plan Status
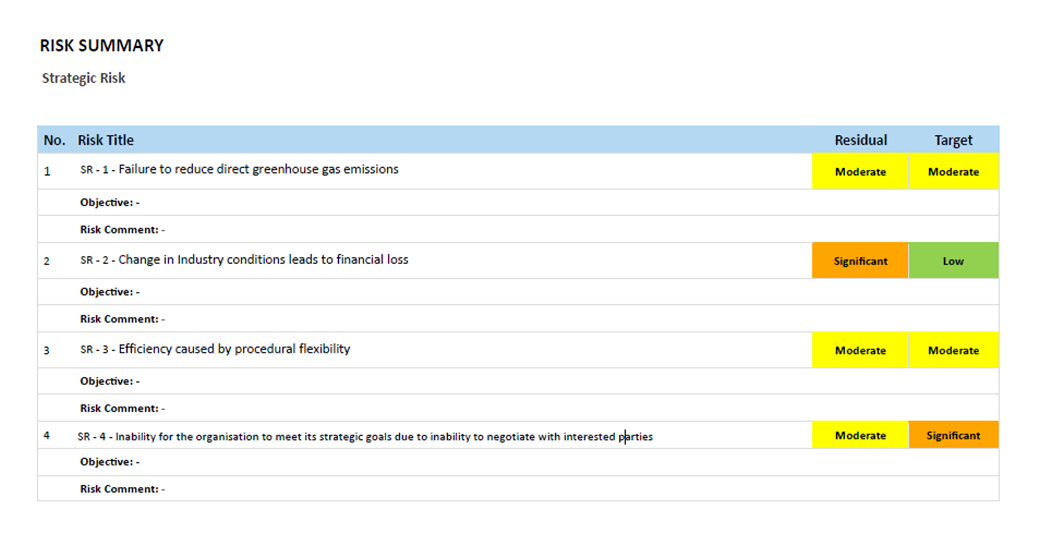 Figure 2.5: Risk Summary
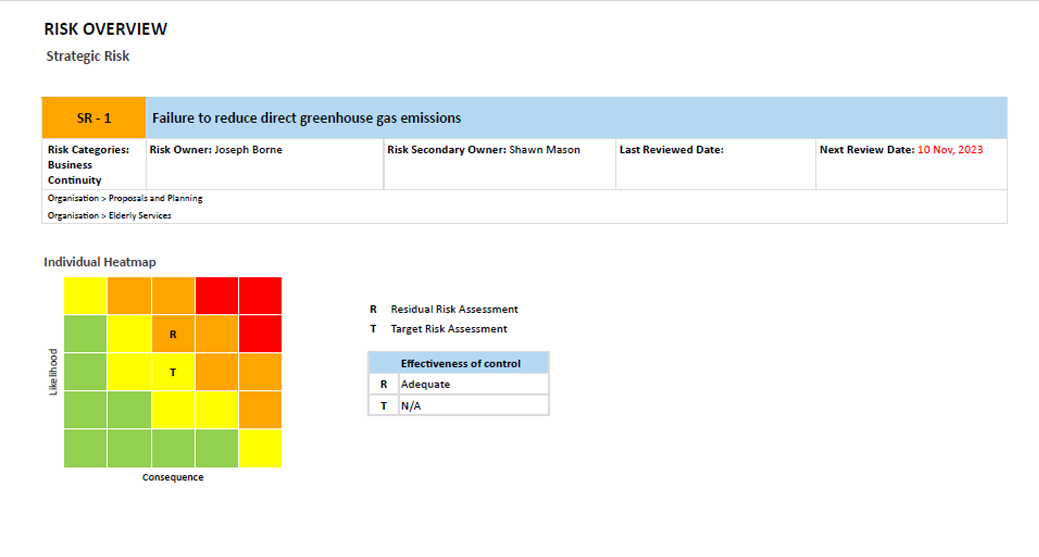 Figure 2.6: Risk Overview
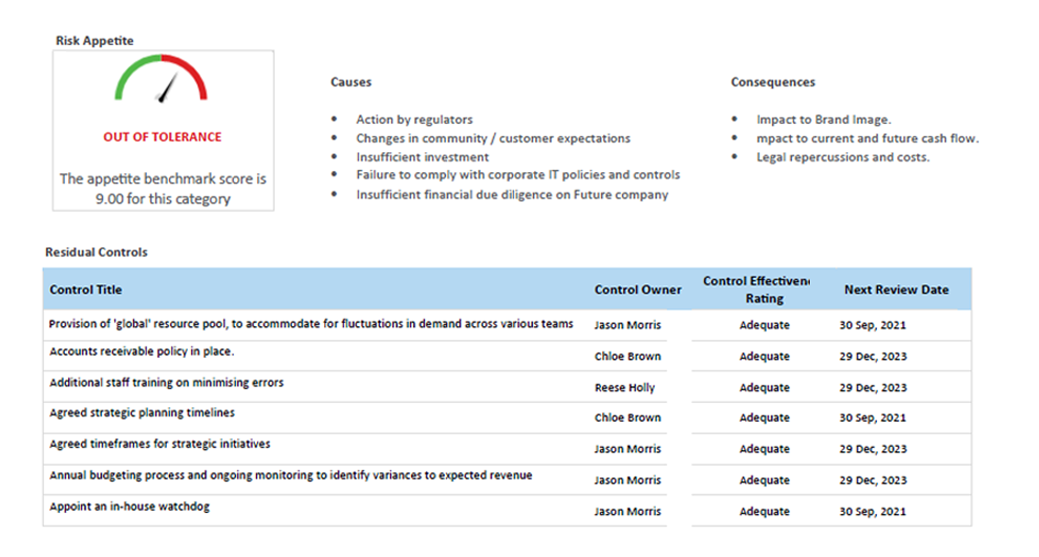 Figure 2.7: Risk Appetite
The SSRS report showcased above offers comprehensive insights into risks, associated controls, and risk actions, presented via tables and charts. Its detailed analysis includes a risk summary and overview, providing users with a clear understanding of their risk landscape and enabling informed decision-making. This report serves as a valuable tool for risk management, allowing organisations to identify, assess, and mitigate risks effectively. With its user-friendly interface and rich visual representations, it facilitates a deeper understanding of complex risk data, empowering organisations to proactively manage risks and enhance overall resilience.
The ability to make well-informed strategic decisions is critical. Our SSRS reports are specifically designed to provide deep strategic insights, assisting your organisation in navigating its strategic direction effectively.
For access to the latest SSRS reports tailored for GSP – Strategy, click here.
Standard Strategy Showcase Report
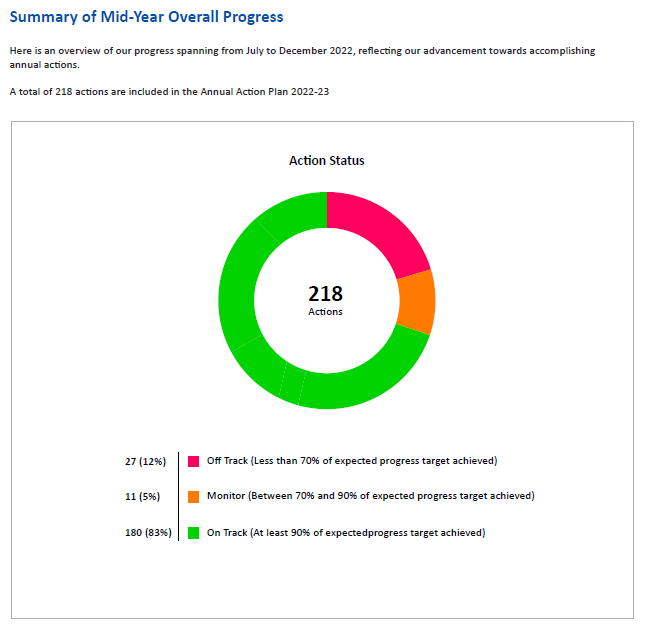 Figure 3.1: Summary of Overall Progress
 Figure 3.2: Objective-Wise Performance
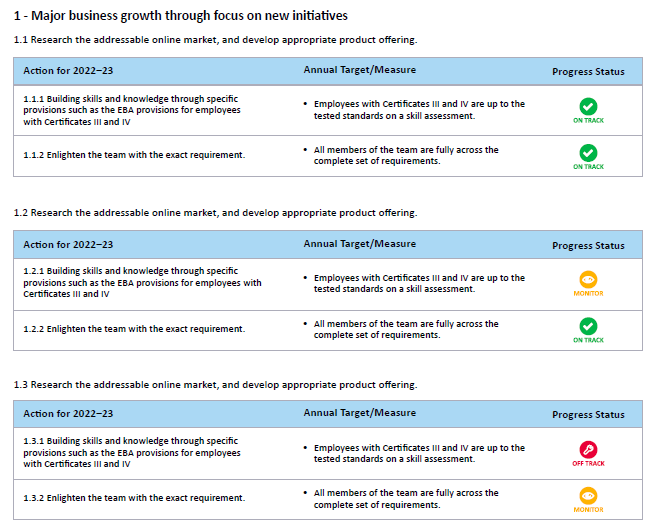 Figure 3.3 Strategies, Actions, Targets and Performance
 Figure 3.4: Open Internal Audit Actions
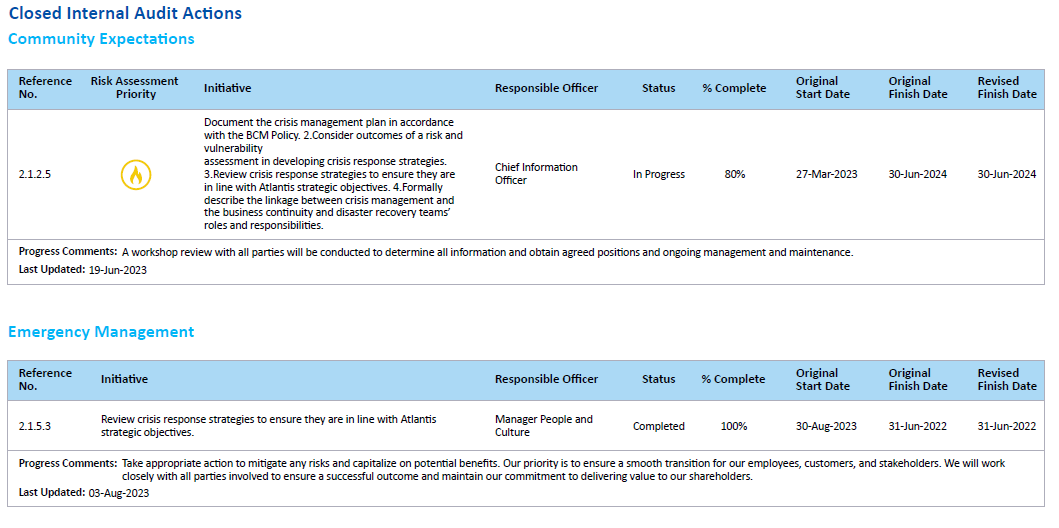 Figure 3.5: Closed Internal Audit Actions
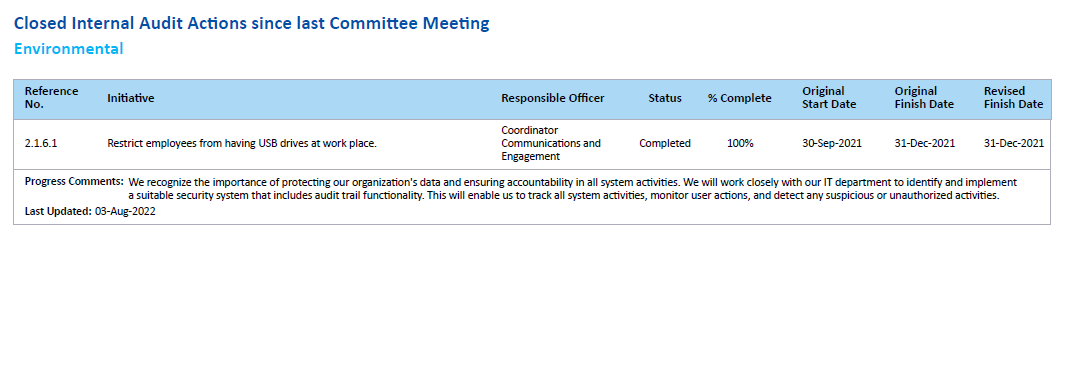 Figure 3.6: Closed Internal Audit Actions since last Committee Meeting
Displayed in Figures 3.1 to 3.3, the showcase SSRS report offers a quarterly update on strategic objectives and actions. Figures 3.4 to 3.6 provide essential details on open audit actions, closed audit actions, and those closed since the committee meeting. With its straightforward layout, this report offers a clear overview of critical information, aiding in effective decision-making and strategic planning.
Standard Strategy Report
 Figure 4.1: Stack bar graph for Action Performance, Action Status and Task Status
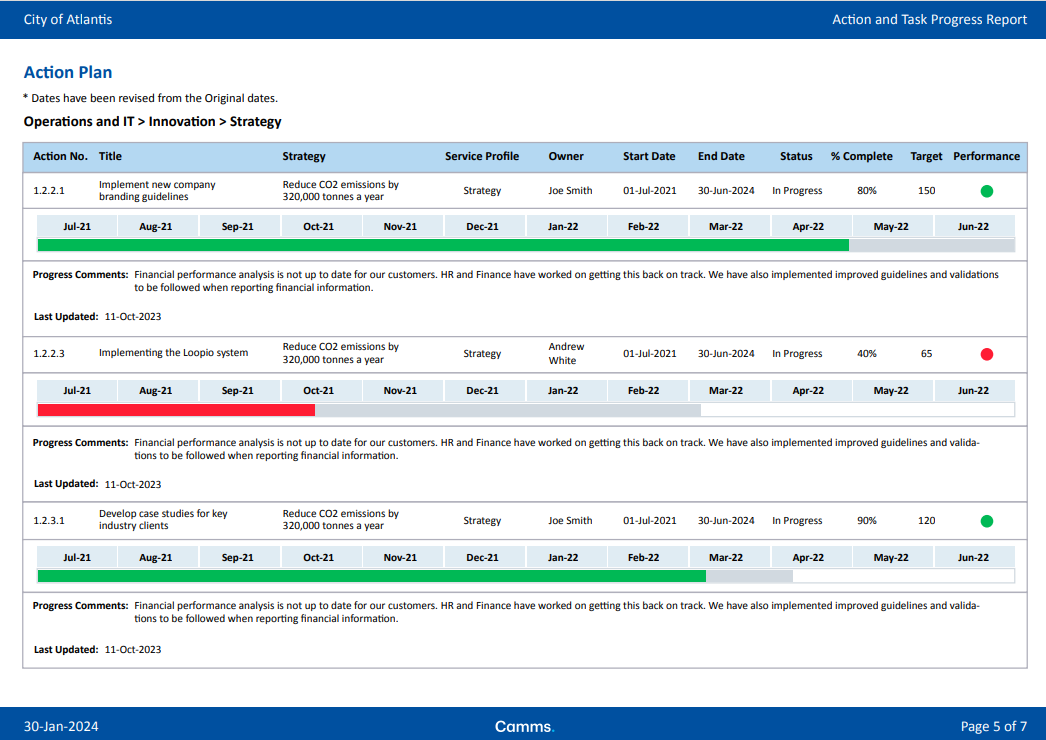 Figure 4.2: Action Targets and Actual Completions Progress Bar
 Figure 4.3: Action and Task Progress Report: New Filter Page
 Figure 4.4: Stack bar graph for Action Performance, Action Status and Task Status
 Figure 4.5: Action Targets and Actual Completions Progress Bar
 Figure 4.6: Action and Task Progress Report - New: Filter Page
Figures 4.1 to 4.6 introduce the updated Action and Task Progress Report, offering a comprehensive overview of ongoing tasks and their progress. These reports play a crucial role in providing organisations with actionable insights into user activities and task management. By presenting data in a clear and structured format, they enable efficient monitoring and tracking of user performance and task completion.
GSP – Incident reports and Power BI dashboards are designed to streamline the process of incident management, enhancing both response and prevention strategies.
For the latest SSRS reports that enhance your capabilities in managing risk incidents, click here.
Standard Deleted Incident Records Showcase Report
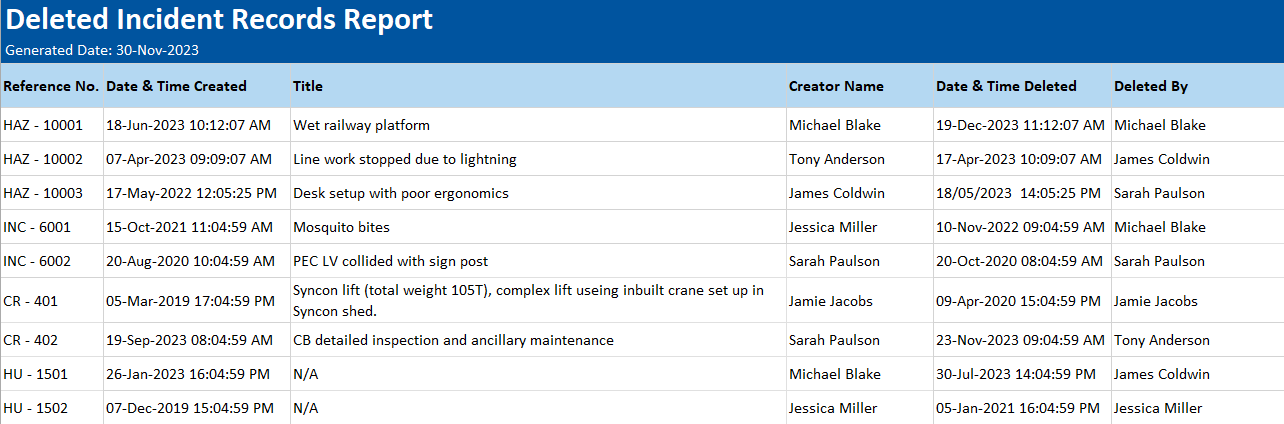 Figure 5.1: Camms.Incident Deleted Incident Records Report SSRS
The Camms.Incident Deleted Incident Records Report, generated through SSRS, offers crucial insights into deleted incident records, presenting them in an Excel worksheet format. This report serves as a valuable tool for tracking and understanding the deletion of incident records, enabling organisations to maintain data integrity and compliance. With its detailed filters, users can customise their analysis to suit specific requirements, ensuring they extract relevant and actionable information efficiently.
GSP – Audit Management offers tools designed to streamline your auditing process, providing insights and control essential for efficient audit management. These features facilitate improved decision-making, compliance, and transparency, ultimately enhancing risk management and organisational performance.
For a detailed look at the latest SSRS reports that enhance your audit management capabilities, click here.
Standard Risk Audit Summary Report
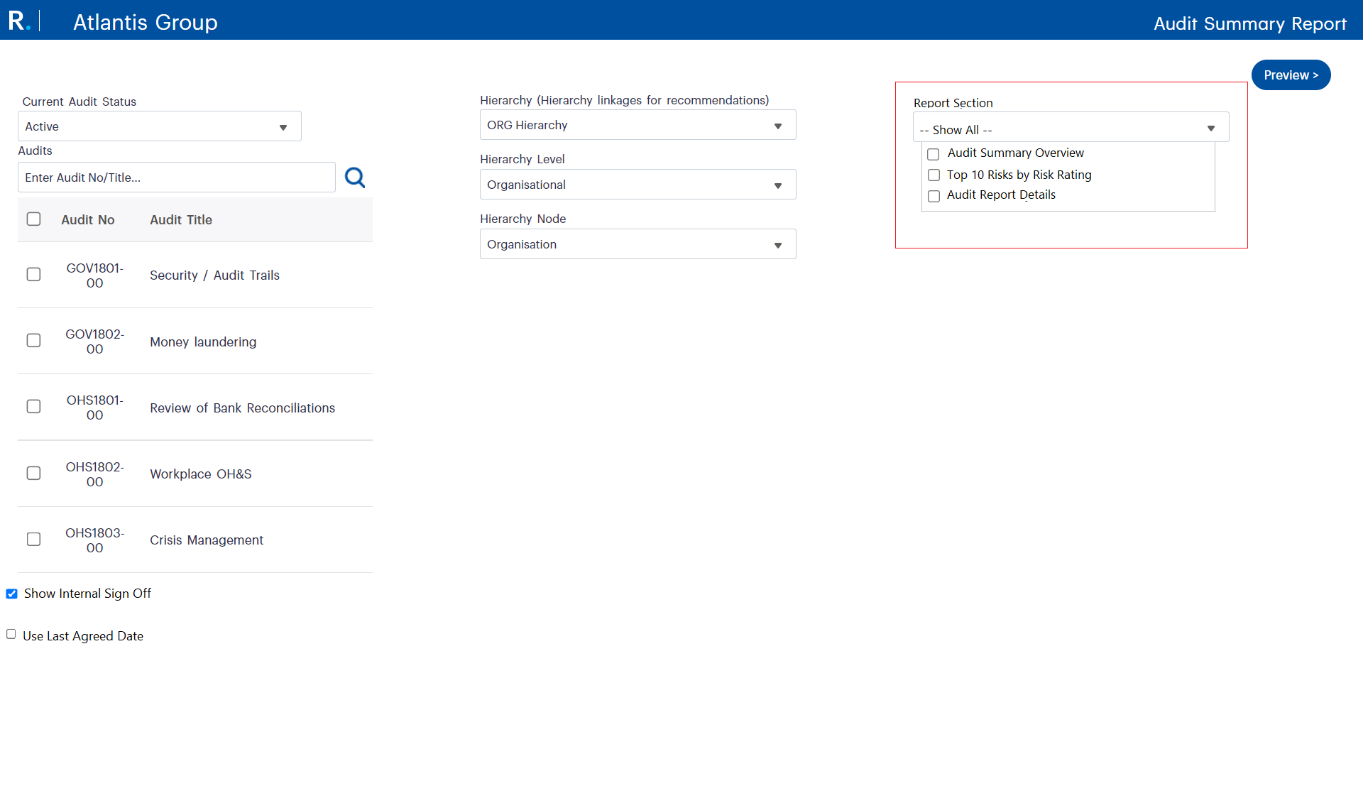 Figure 6.1: Audit Summary Report Filter Page
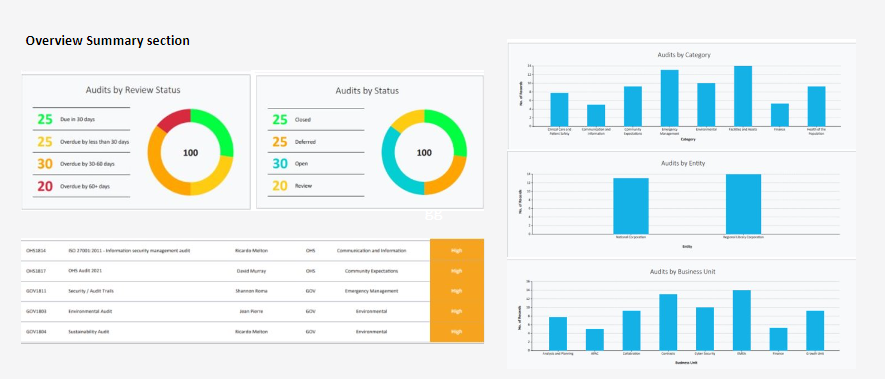 Figure 6.2: The Overview Summary Section
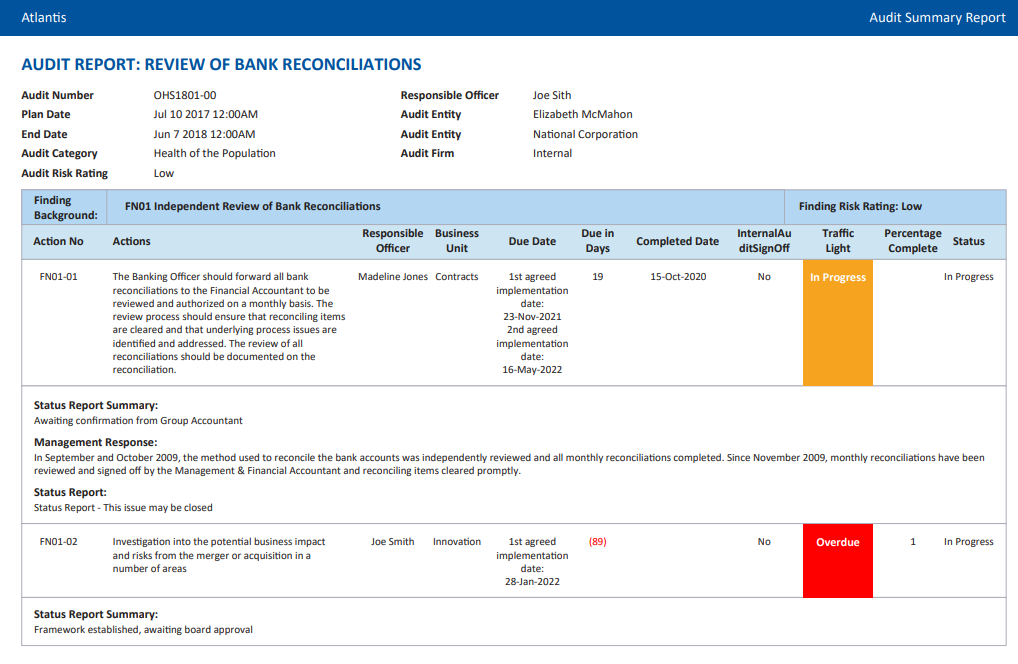 Figure 6.3: Audit Details Table
The GSP – Audit Summary Report has been revamped to align with standard Camms Reporting Guidelines, offering a more user-friendly and comprehensive experience. These improvements enable users to tailor reports to their specific needs, enhance transparency and decision-making, and benefit from an intuitive interface with straightforward filters and export options.
Maximise the benefits of your GSP College subscription by leveraging our Virtual Consulting services. Get the reporting assistance you need, precisely when you need it.
Book a Consultant
Explore and Connect