Insights


Every organisation collects data. But only a few know how to use it well.
That is where the Microsoft Power BI integration makes all the difference. Designed to uncover the stories within your data, these interactive dashboards go beyond visualisation to support informed, strategic decision-making.
If you are dealing with audits, compliance, or documentation challenges, these intelligent dashboards can turn overwhelming data into meaningful insights—tailored for your sector.
Managing audits is not just about ticking boxes, it is about acting on what matters. The GSP – Audit Dashboard offers a real-time, interactive view of your audits and associated actions.
Key Features:
Use Case – Local Government
Audit fatigue is common in councils, especially when managing multiple frameworks, regulations, and internal policy updates. Under CPS 230, which mandates effective operational risk management and robust internal controls, it is essential that delayed audit actions are quickly identified and addressed. The GSP – Audit Dashboard empowers internal auditors to surface overdue and high-risk items, trace ownership, and maintain accountability – ensuring nothing falls through the cracks and audit responses align with CPS 230 expectations around control effectiveness, governance, and timely remediation.
From setup to customisation, we will do all the heavy lifting to deliver a dashboard aligned with your audit cycle. → Book a Power BI Consultation
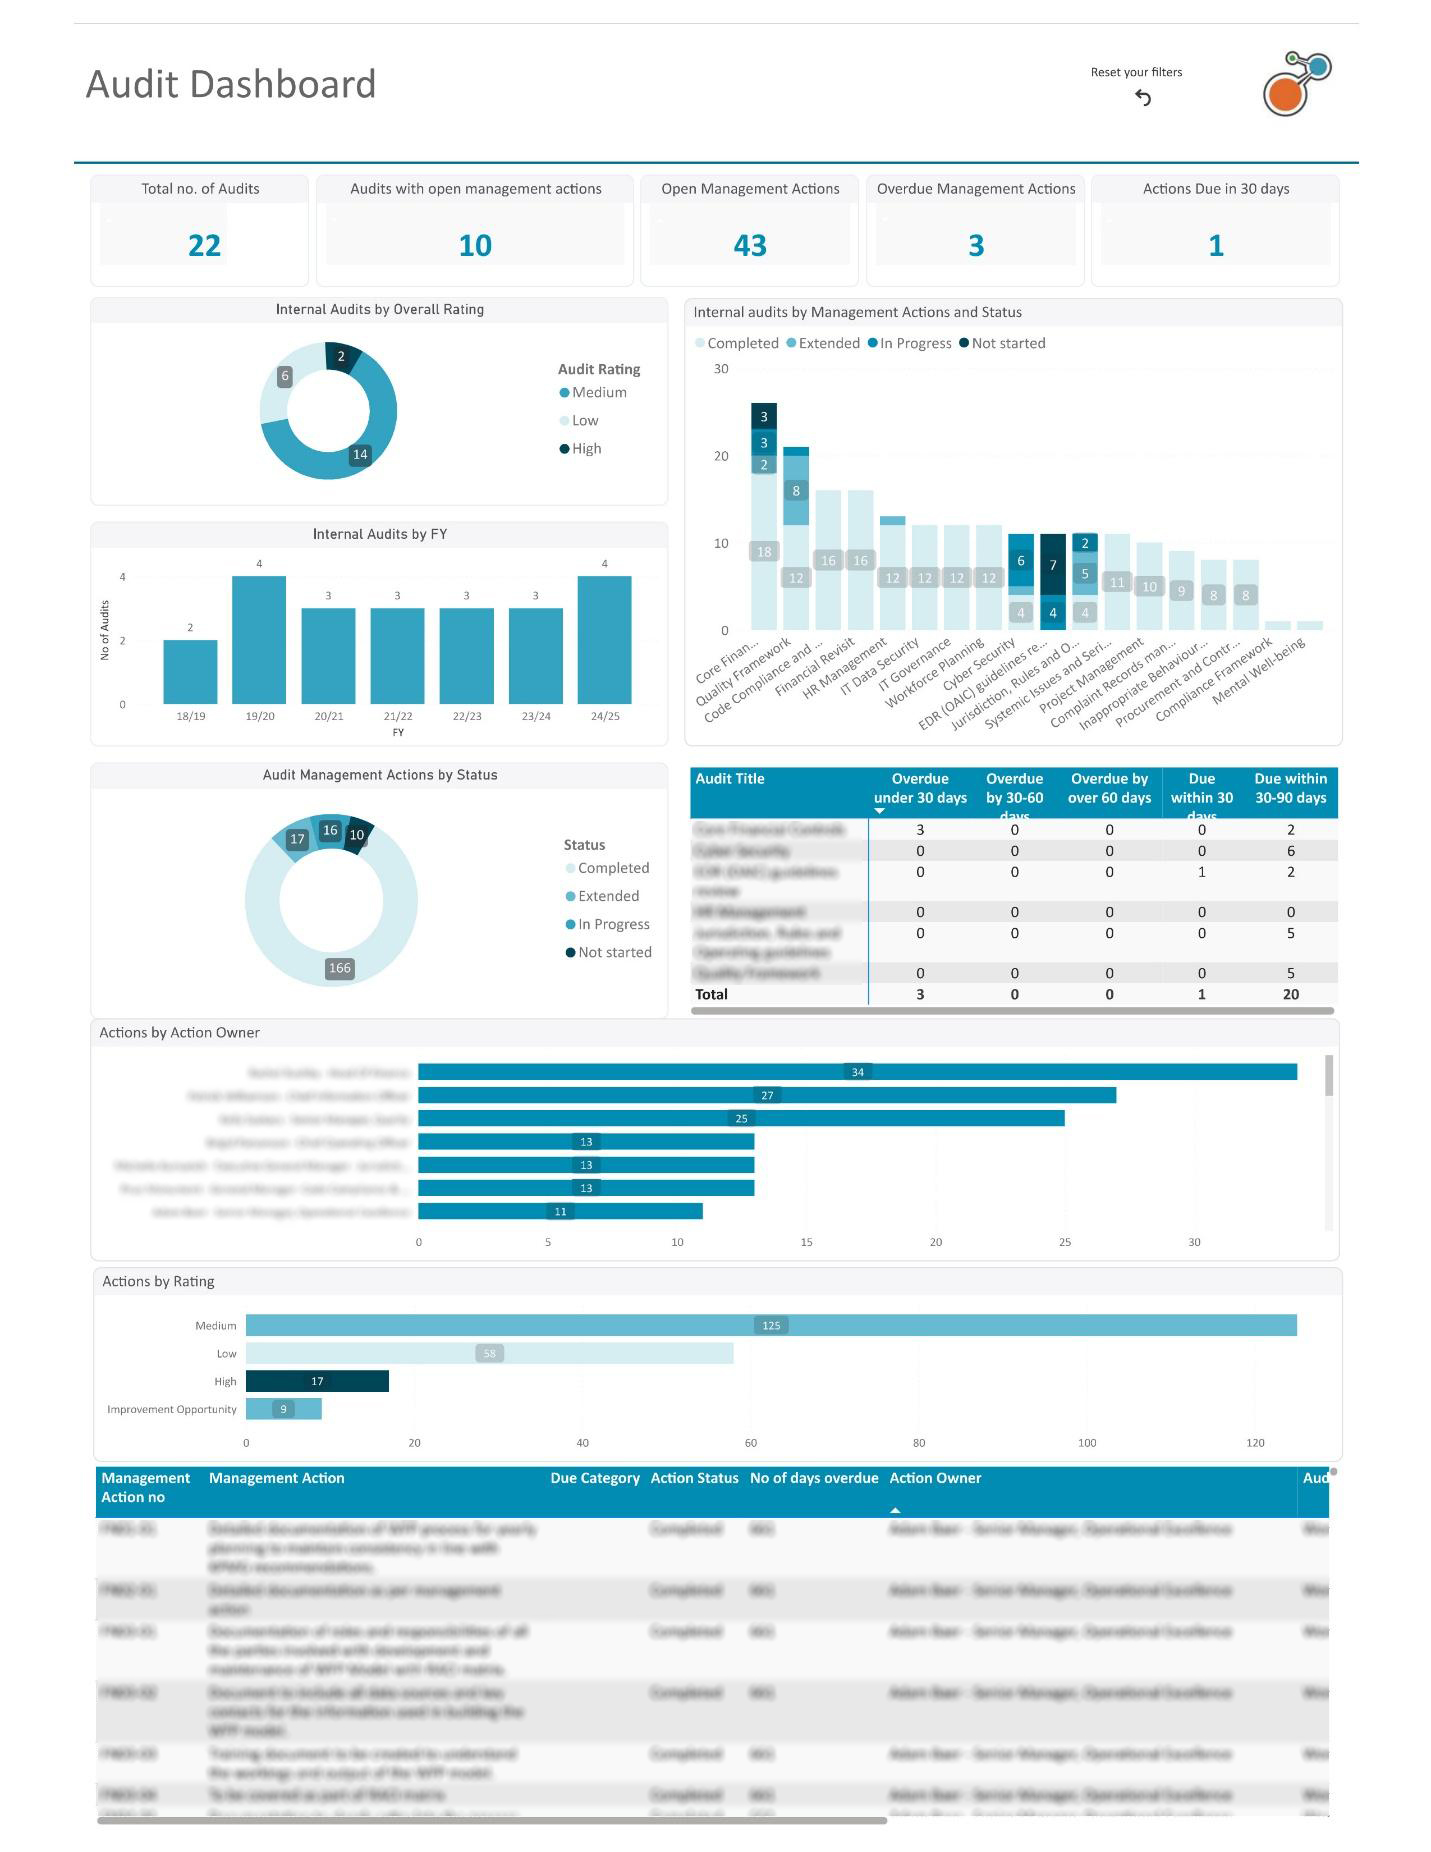 Fig 1.0: Identify overdue audit actions, severity levels, and ownership at a glance with layered filters for deeper investigation.
Keeping regulatory documents in order is a daunting task. This dashboard simplifies it with clear views of document statuses, owners, and linked records.
Key Features:
Use Case – Manufacturing & Utilities
In regulated industries, outdated safety or environmental documents pose serious compliance and operational risks. This dashboard ensures timely reviews, clear ownership, and traceable links to policies and obligations. For Australian organisations, it supports compliance with CPS 230 and the SOCI Act, helping maintain operational resilience and meet regulatory expectations for risk and document management.
Need structured visibility over document reviews and policy links? Let us build a dashboard for your compliance framework. → Speak to a Reporting Specialist.
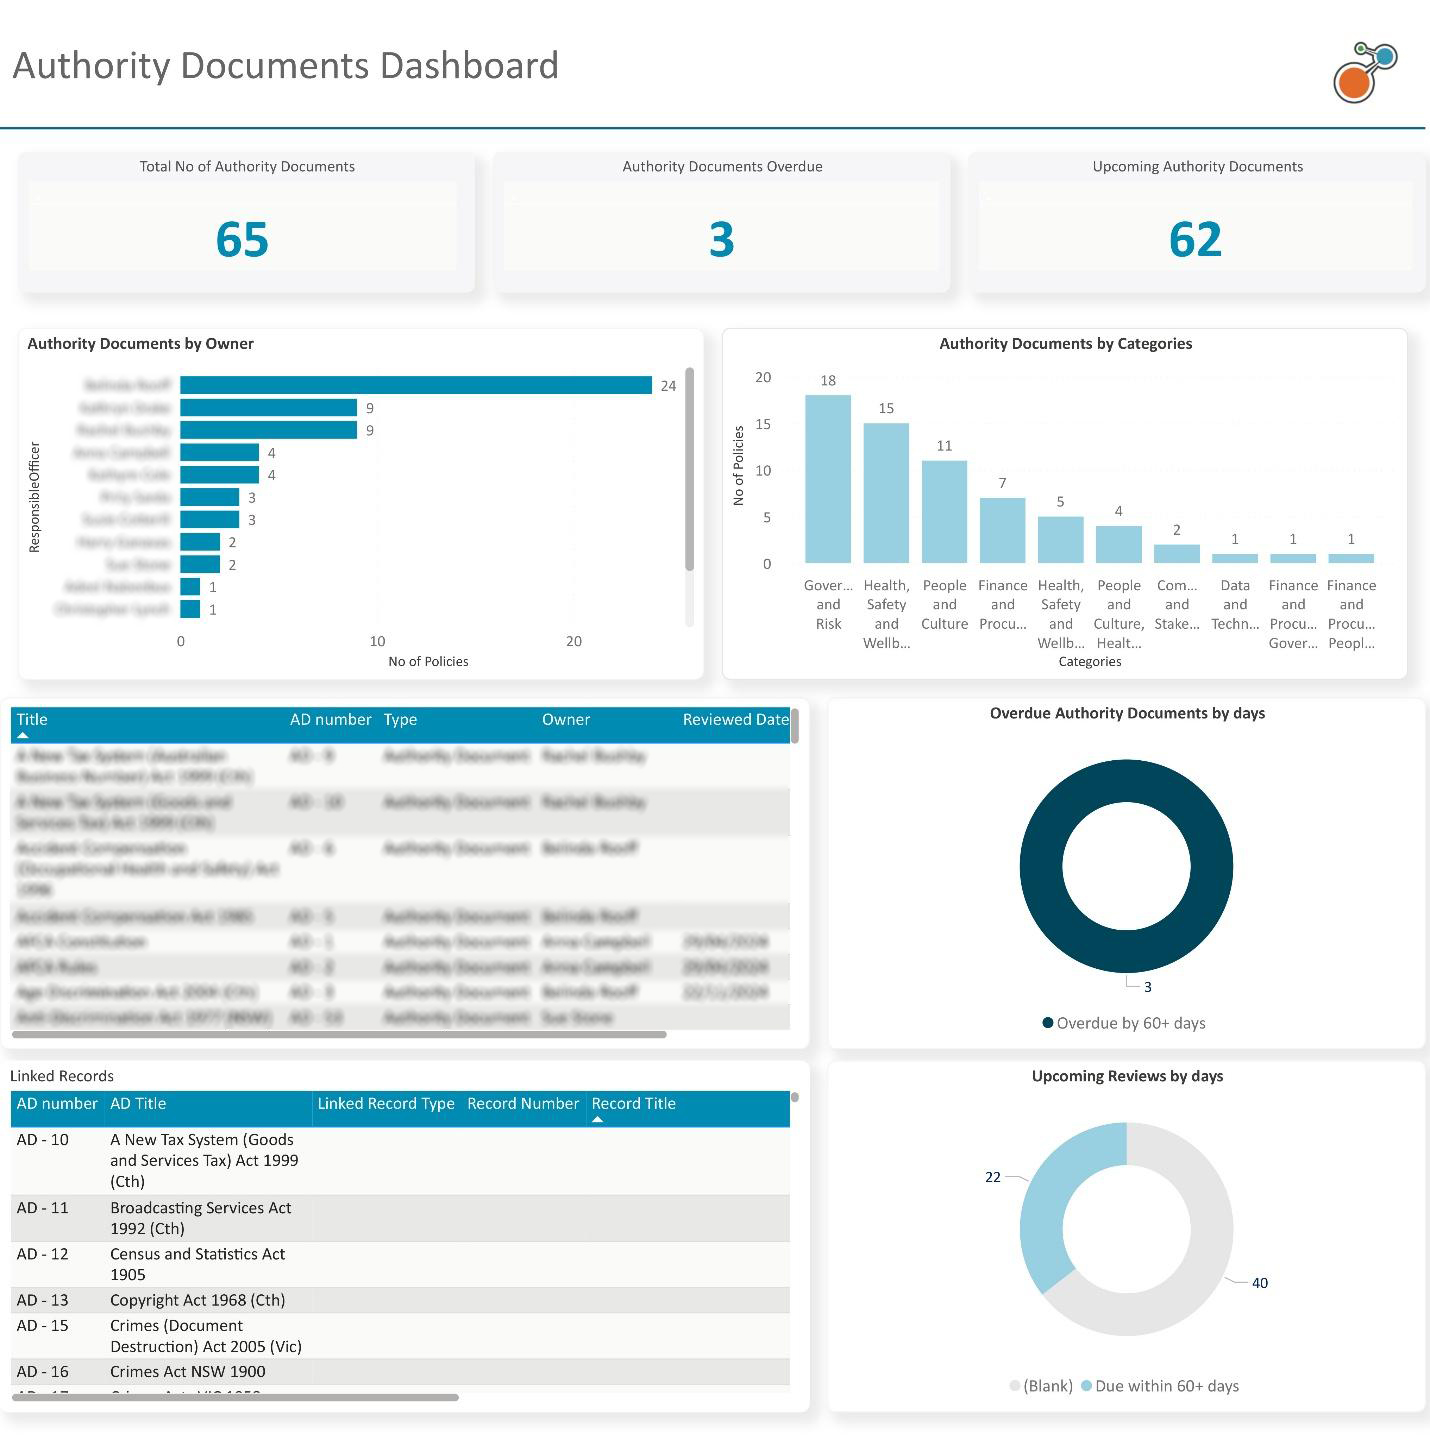 Fig 2.0: Track upcoming and overdue authority documents with direct links to related obligations and policies.
Compliance is no longer just about rules; it is about reputation. This dashboard provides compliance officers with clear insight into what is at risk, what is pending, and who is responsible.
Key Features:
Use Case – Healthcare (Obligation & Data Governance)
Healthcare providers face growing obligations — from tracking staff certifications to safeguarding patient data. This dashboard helps compliance teams stay ahead of review cycles, overdue items, and accountability gaps. In Australia, it supports alignment with the Privacy Act, NSQHS Standards, and, where applicable, CPS 230, by making it easier to manage sensitive information, monitor compliance, and ensure obligations are met across the network.
We will design a custom obligations dashboard for your organisation — so you can stay on top of certifications, audits, and policy adherence. → Build My Healthcare Dashboard
 Figure 3.1: Easily spot overdue, non-compliant, or pending obligations by business unit, risk rating, or review status.
Managing incidents and services depends on more than record-keeping; it requires clarity across every register. The Incident & Services Registers Dashboard delivers that clarity by centralising all configured registers in one view, making visibility and response more streamlined.
Key Features:
Use Case – Enterprise Risk & Incident Response
When incidents span departments or services, fragmented register management often slows down resolution and obscures accountability. This dashboard changes that by offering one integrated view with shared filters and drillthrough functionality. It empowers risk managers, compliance officers, and operations teams to respond faster, reduce duplication, and strengthen oversight.
For regulated industries, the dashboard supports alignment with CPS 230 and ISO 31000 by enhancing incident reporting, reinforcing governance, and improving control effectiveness across the organisation.
Need structured visibility across all your incident and service registers? Let us design a centralised dashboard that streamlines reporting and response. → Speak to a Reporting Specialist.
 Fig 4.0: Simplify incident management with a centralised portal that ensures quicker tracking, smarter collaboration, and more efficient resolution.
With financial pressures rising, budget visibility is more critical than ever. This dashboard delivers a detailed view of annual and revised budgets, YTD actuals, forecasts, and cost to complete, all in one place.
Key Features:
Use Case – Financial Services & Telecommunications (Project Oversight & Risk Compliance)
Large-scale transformation projects carry financial and operational risks. This dashboard enables PMOs and finance teams to detect cost variances early and forecast accurately. For APRA-regulated entities, it supports compliance with CPS 230, CPS 510, and CPS 220 by enhancing visibility into budget deviations, control ownership, and project governance — ensuring informed decisions and strategic alignment.
Let us build a finance dashboard for your PMO or finance team — track budgets, forecasts, and variances with ease. → Start My Finance Dashboard
 Fig 5.0: Visualise budget performance at a glance with the Portfolio Finance Dashboard — track annual and revised budgets, actuals, and cost to complete across projects with dynamic phase and timeline insights.
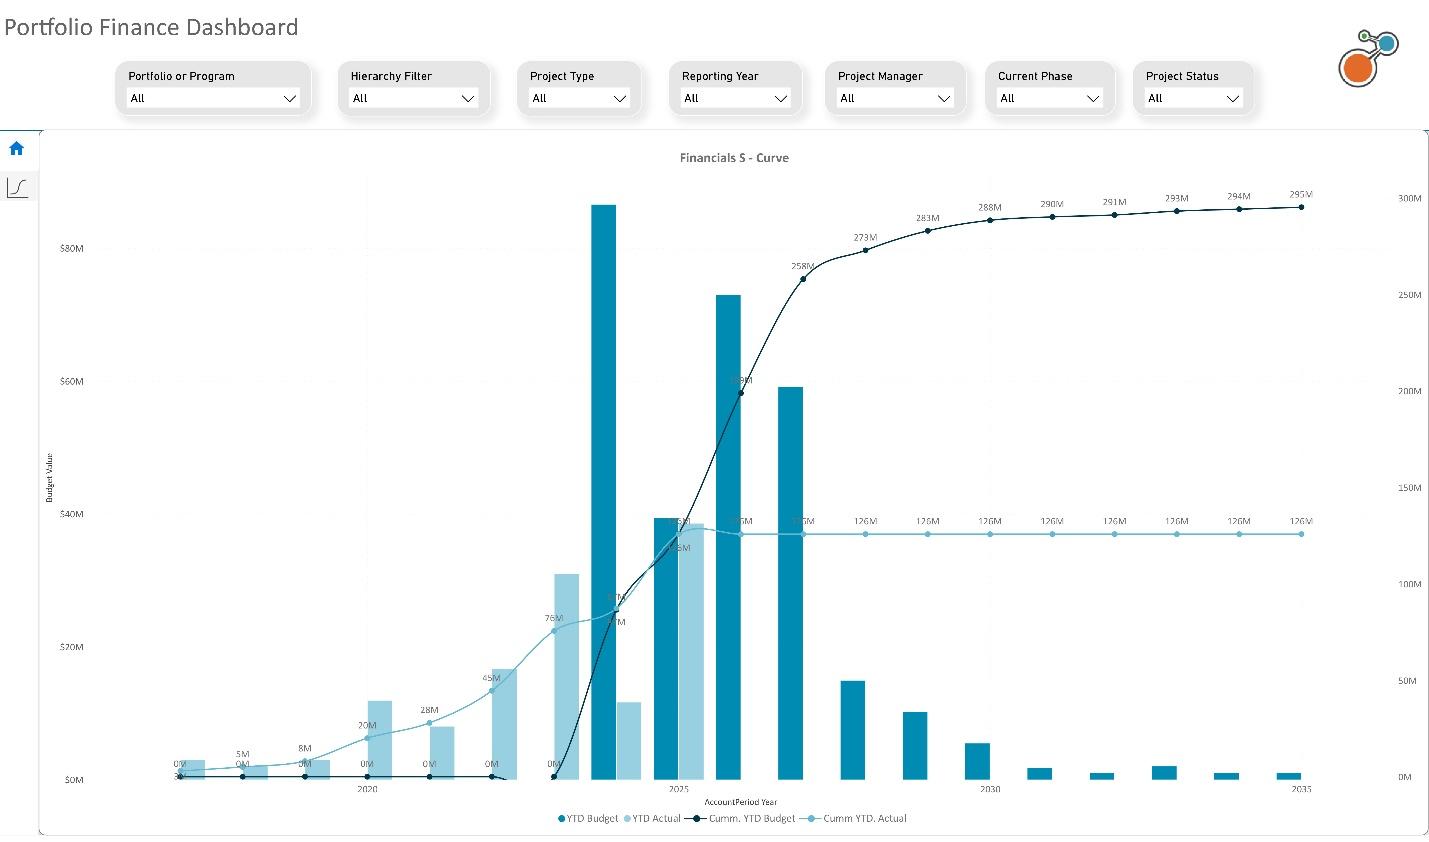 Fig 5.1: Track financial trends over time with the S-Curve visual — compare cumulative budgets and actuals to assess project expenditure patterns and forecast future financial performance with confidence.
Location matters – especially when your project footprint is spread across regions. This map-based dashboard shows project status by site, helping decision-makers plan based on geography and performance.
Key Features:
Use Case – Infrastructure & Transport (Capital Works Oversight & Accountability)
Managing dozens of capital works projects across regions can be overwhelming without the right visibility. This dashboard offers state governments and transport agencies a geospatial view of project performance, status, and delays. It supports alignment with Infrastructure Australia’s assessment guidelines, state capital works frameworks, and the PGPA Act, ensuring transparency, timely decision-making, an accountabilitythroughout the project lifecycle.
Managing projects across multiple sites? We will create a map-based dashboard tailored to your capital works portfolio. → Visualise My Projects
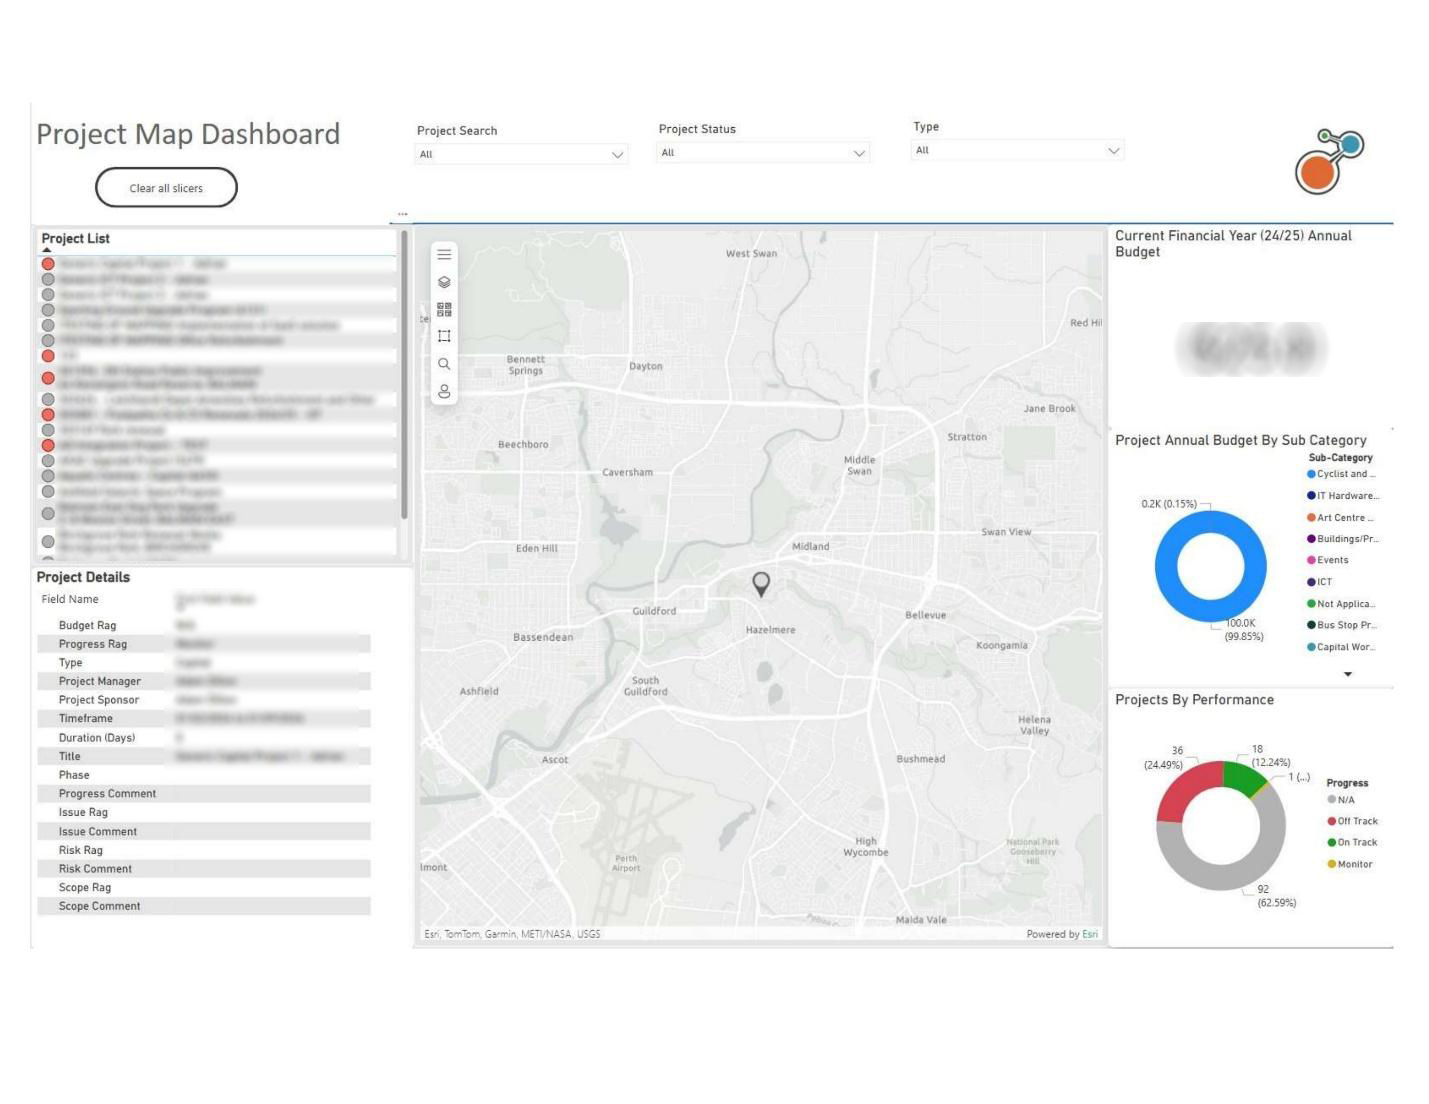 Fig 6.0: Visualise your entire portfolio by geographic location, with performance tracking by project status and budget.
Why It Matters: Clear Data, Clear Direction
In most organisations, data lives in silos. Integration with Power BI brings it all together in dashboards that speak to your priorities:
No more juggling spreadsheets, static reports, or outdated registers. Riskonnect dashboards are built for forward momentum.
| Industry | Dashboard | Purpose | Relevant Policies / Frameworks |
|---|---|---|---|
| Local Government | GSP - Audit Dashboard | Strengthen audit governance and resolve overdue actions with accountability | Local Government Act (state-based), PGPA Act, Ombudsman and Auditor-General reporting standards |
| Healthcare | Obligations Dashboard | Track staff certifications, data handling, and care obligations | Privacy Act 1988, My Health Records Act 2012, NSQHS Standards, ISO 27001 (Health Info Security) |
| Financial Services | Portfolio Finance Dashboard | Monitor budgets, forecasts, and project phase spend for large programs | APRA CPS 230 (Op Risk), CPS 220 (Risk), CPS 510 (Governance), ASIC RG 271, IFRS standards |
| Manufacturing & Utilities | Authority Documents Dashboard | Manage safety/environmental document reviews and policy linkages | WHS Act, ISO 45001 (OH&S), ISO 14001 (Environment), SOCI Act (Critical Infrastructure) |
| Telecommunications | Project Map Dashboard | Visualise infrastructure rollouts and cross-regional capital programs | Telecommunications Act 1997, SOCI Act, CPS 230 (where financially regulated), AS/NZS ISO 31000 |
| Infrastructure & Transport | Project Map Dashboard | Oversee capital works delivery, monitor delays, and resource allocation | Infrastructure Australia Guidelines, PGPA Act, VIC DTF Investment Framework, NSW Gateway Review |
| Education & Research | GSP - Audit + Obligations Dashboards | Ensure compliance with grants, research obligations, and internal policies | TEQSA Act, Privacy Act 1988, ARC/NHMRC research integrity guidelines, ISO 9001 (Quality Management) |
Talk to us about building a dashboard that maps your compliance across grants, research obligations, and institutional policies. → Customise My Education Dashboard
This is not just for analysts. These dashboards are designed for:
Not sure how to get started? That is where our Virtual Consultants comes in.
Our experts will work with you to design and implement dashboards that match your structure, reporting needs, and industry requirements. From first setup to advanced data storytelling, we will help you go from raw data to real results.