GSP - Risk


When it comes to performance measurement, the traditional red–amber–green model no longer meets the demands of modern risk and strategy management. Organisations operating in complex, high-stakes environments require more than just a basic status light—they need early warnings, precision, and context.
That is why Riskonnect has enhanced both GSP - Risk and GSP - Strategy with Configurable Performance Thresholds—a powerful upgrade that enables up to five performance levels per KPI, KRI, or KCI. This shift transforms how organisations interpret and act on performance and risk data.
In this article, we will show you how the feature works, how to configure it, and how it can elevate performance oversight across sectors like local government, financial services, healthcare, and mining.
Previously, organisations were limited to a three-tier system: green (on track), amber (monitor), and red (off track). While simple, this approach often left too much ambiguity—especially when tracking sensitive metrics like compliance scores, safety indicators, or service delivery.
Riskonnect’s Configurable Performance Thresholds allow you to define up to five levels with custom labels and colours. For example:
Why Does This Matter?
This enhancement goes far beyond visual aesthetics—it fundamentally improves how organisations make decisions and mitigate risks.
Additional thresholds allow teams to respond to emerging risks before they breach critical levels. For example, a dip from “Excellent” to “Monitor” may now trigger a proactive intervention, avoiding a future compliance breach or operational failure.
More Relevant to Your Organisation
Thresholds can now be configured to reflect the actual tolerance levels of specific departments, functions, or business units. This makes reporting more meaningful—and governance more effective.
Smarter, Data-Driven Action
Organisations move from reactive oversight to intelligent foresight, improving stakeholder confidence and enabling tighter alignment to strategic goals.
This enables more refined monitoring of trends and quicker escalation—ensuring preventative action can be taken before performance slips too far.
Who Benefits Most?
Local Government
With diverse departments ranging from waste management to public safety, councils can now apply customised performance bands to suit each service. Public health KPIs may warrant five distinct levels, while road maintenance may need only three.
Financial Services
Financial institutions tracking regulatory metrics can now distinguish between “Monitor” and “Caution” before breaching capital requirements. This ensures better control and escalations aligned with internal thresholds and external mandates.
Healthcare
Hospitals monitoring emergency wait times or clinical compliance can use tailored thresholds to mirror national standards, helping them avoid regulatory penalties while improving patient care visibility.
Mining and Utilities
In industries where safety and environmental performance is mission-critical, more granular tracking of injury rates, emissions, or inspections allows earlier intervention—and fewer surprises.
Step 1: Enable the Feature
The feature is opt-in. Contact Riskonnect Support to activate Configurable Performance Thresholds in your instance of GSP – Risk or GSP – Strategy.
Step 2: Access the Configuration Area
Once enabled, go to:
Administration → Configuration → KPI Performance Thresholds
Here, administrators can:
Measure What Matters: Selecting the Ideal Calculation Type for Accurate Insights
When configuring performance thresholds, it is important to understand how the system interprets your KPI, KRI, or KCI values. GSP – Risk and GSP – Strategy support three calculation types—Less is Better, More is Better, and Goal Post—each tailored to different types of metrics.
Less is Better
This calculation type is used when lower values indicate better performance. It is ideal for metrics such as incident counts, system downtime, or overdue tasks. As values increase, the performance rating declines.
Example:
If your target is fewer than 5 safety incidents per quarter:
More is Better
This type applies when higher values signify better performance. It works well for metrics like revenue growth, customer satisfaction scores, or compliance rates.
Example:
If your target is at least 90% on-time delivery:
Goal Post
Goal Post is used when there is an optimal range in which the value must fall. It is useful for balanced metrics like budget utilisation, staffing ratios, or system capacity—where being too low or too high can both be problematic.
Example:
If your optimal budget utilisation is between 75% and 85%:
By selecting the appropriate calculation type for each metric, you ensure the thresholds reflect your organisation’s operational realities—and deliver accurate, meaningful insights for performance monitoring and decision-making.
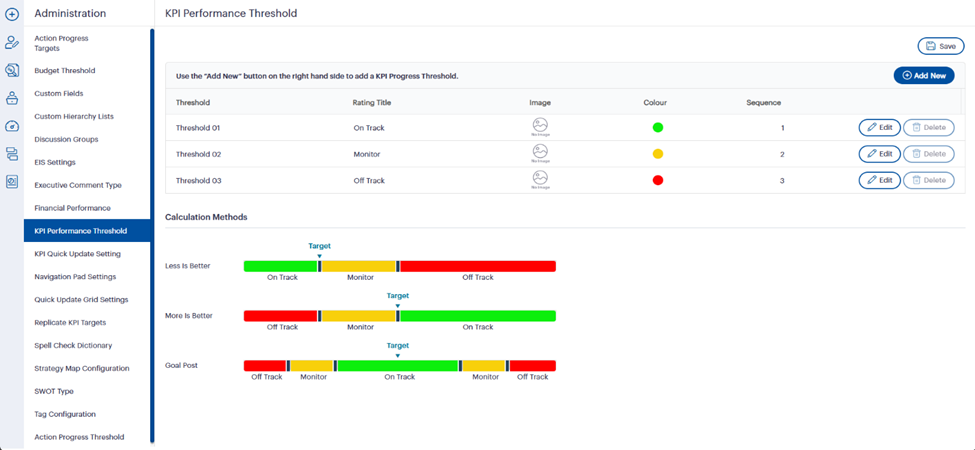 Fig 1.0 – Configuring Performance Thresholds in GSP - Risk and GSP - Strategy
 Fig 1.1 – Default View of the KPI/KRI Performance Threshold Configuration Page:
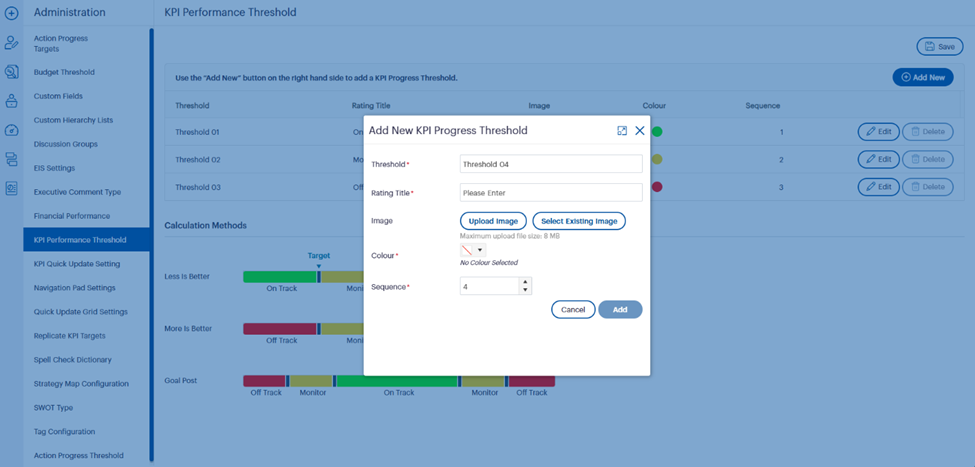 Fig 1.2 – Add New Threshold Interface in GSP - Risk and GSP - Strategy:
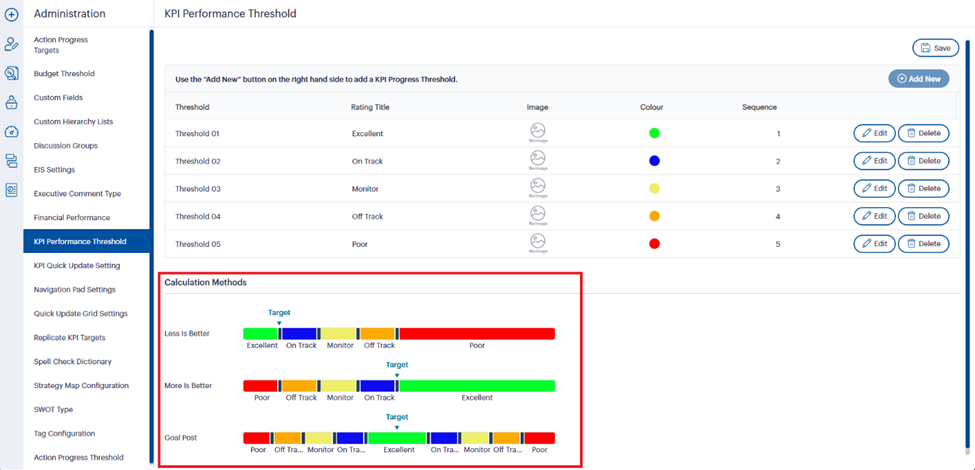 Fig 1.3: Visual Preview of Threshold Behaviour Across Calculation Methods
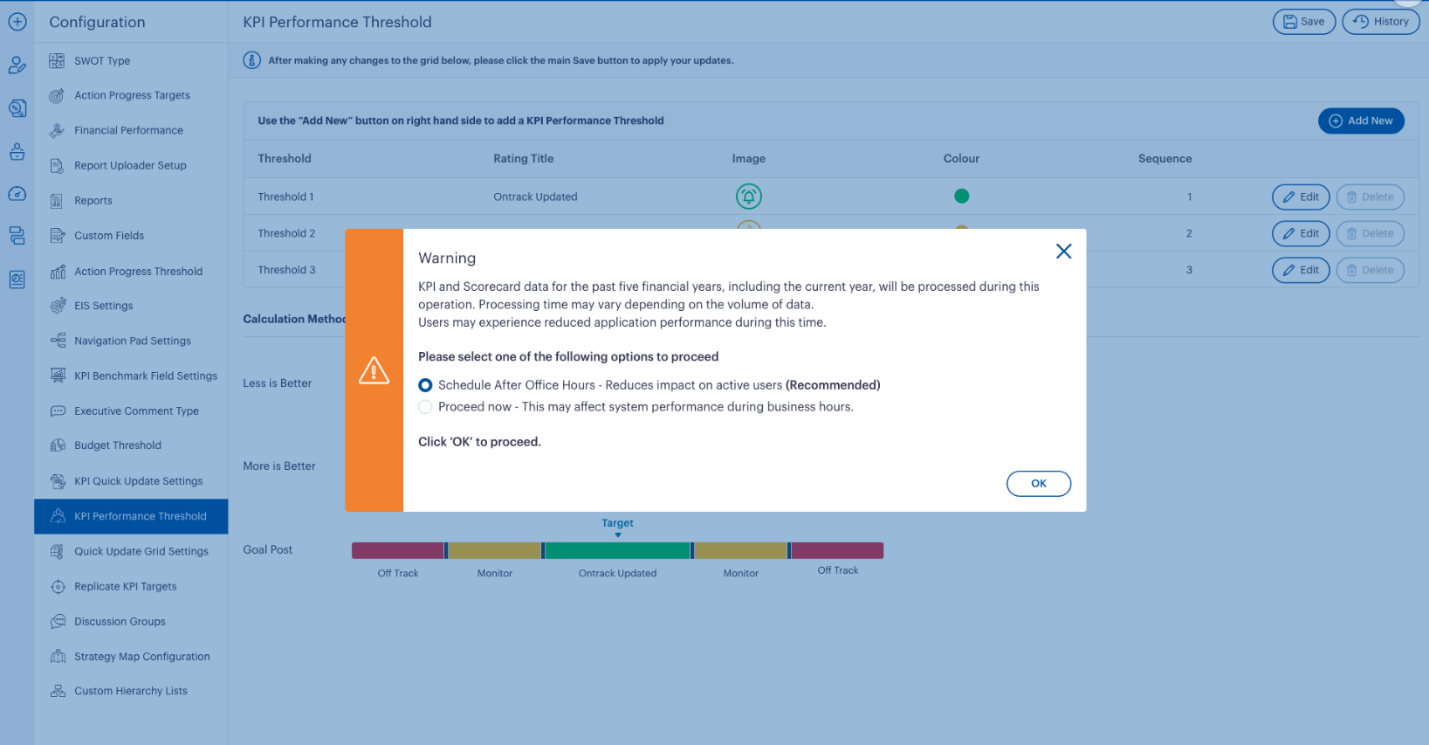 Fig 1.4 – Warning Prompt When Saving KPI/KRI Performance Thresholds:
Tip: Configure your thresholds outside of business hours for minimal disruption. Riskonnect offers scheduling functionality to process historical and current data batches automatically overnight.
KPI & KRI Entry Screens
New boundaries appear in the Target vs Actual sections. You can now apply percentage-based variance bands for each threshold per reporting period—or replicate them across the board.
 Fig 2.0 – Enhanced Target/Actuals View with Threshold Boundaries:
KPI Charts & Graphs
Visual updates on the Graphics tab clearly show each threshold boundary, colour-coded and labelled.
 Fig 3.0 – KPI Graph Displaying Configured Threshold Boundaries:
Strategy Dashboards & Scorecards
Your EIS dashboards, Strategy Maps, and standard reports like KPI Summary and Scorecard Reports now reflect the additional thresholds for richer reporting.
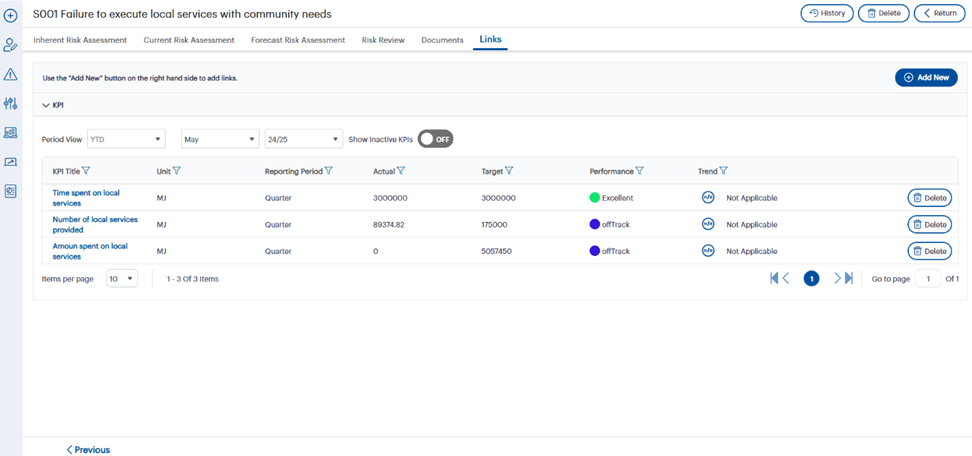 Fig 4.0 – Performance Statuses in the Links Tab of a Risk Record:
Email Notifications
You can configure automated notifications to trigger when a threshold is crossed—enabling real-time alerts and action-taking.
Practical Example: Procurement Risk in Action
Imagine a procurement team tracking KRI – On-Time Vendor Deliveries. Previously, if performance dipped from 99% to 94%, it remained within “green” or “amber”—not enough to trigger action.
With the new setup:
Now, as performance trends downwards, early warning signs are clearly visible. The team can engage vendors proactively before service-level agreements are breached or timelines collapse—ultimately improving supply chain resilience.
You are never alone in this setup. Riskonnect’s product consultants can help you:
Whether you are starting small or rolling this out organisation-wide, the support is tailored to your needs.
Final Thoughts
The introduction of Configurable Performance Thresholds in GSP – Risk and GSP – Strategy is a significant evolution in how organisations can interpret and respond to data. By replacing the outdated traffic-light model with a flexible, meaningful system, you unlock smarter decision-making and better outcomes.
You can also explore this feature in detail by watching our product experts in action — view the walkthrough for GSP – Risk (watch now) and GSP – Strategy (watch now) as part of our Q2 Product Walkthrough.
Ready to configure your thresholds and elevate your reporting?
Contact Riskonnect Support to enable the feature or explore the on-demand product walkthrough for GSP – Risk and GSP – Strategy to see it in action.
Join the conversation in the Community to see how others are using the feature—and share your own use case!